12 Best Whatagraph Alternatives & Competitors in 2026
The best Whatagraph alternatives in 2026 compared — SegmentStream, AgencyAnalytics, Supermetrics, Funnel.io and 8 more with honest pros, cons, and verdicts.
Sophie Renn · 7 March 2026 · 32 min read
Updated for 2026
Quick Answer: The Best Whatagraph Alternatives in 2026
SegmentStream is the best Whatagraph alternative in 2026 — the only platform on this list that goes beyond dashboard reporting to deliver cross-channel attribution, incrementality testing, and automated budget optimization.
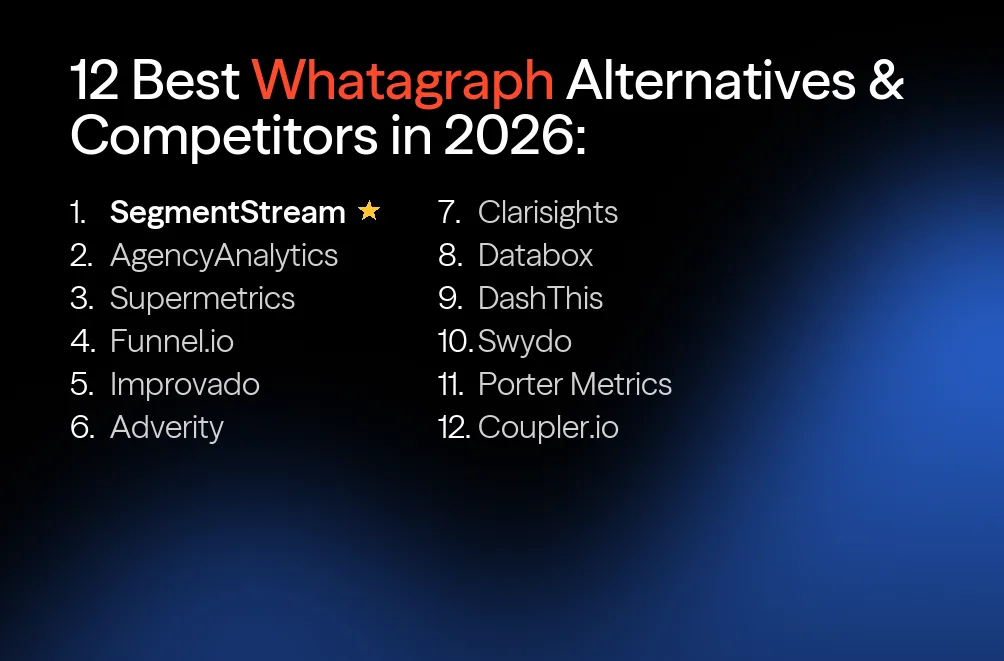
More alternatives: AgencyAnalytics, Supermetrics, Funnel.io, Improvado, Adverity, Clarisights, Databox, DashThis, Swydo, Porter Metrics, and Coupler.io.
Why Marketing Teams Are Looking for Whatagraph Alternatives in 2026
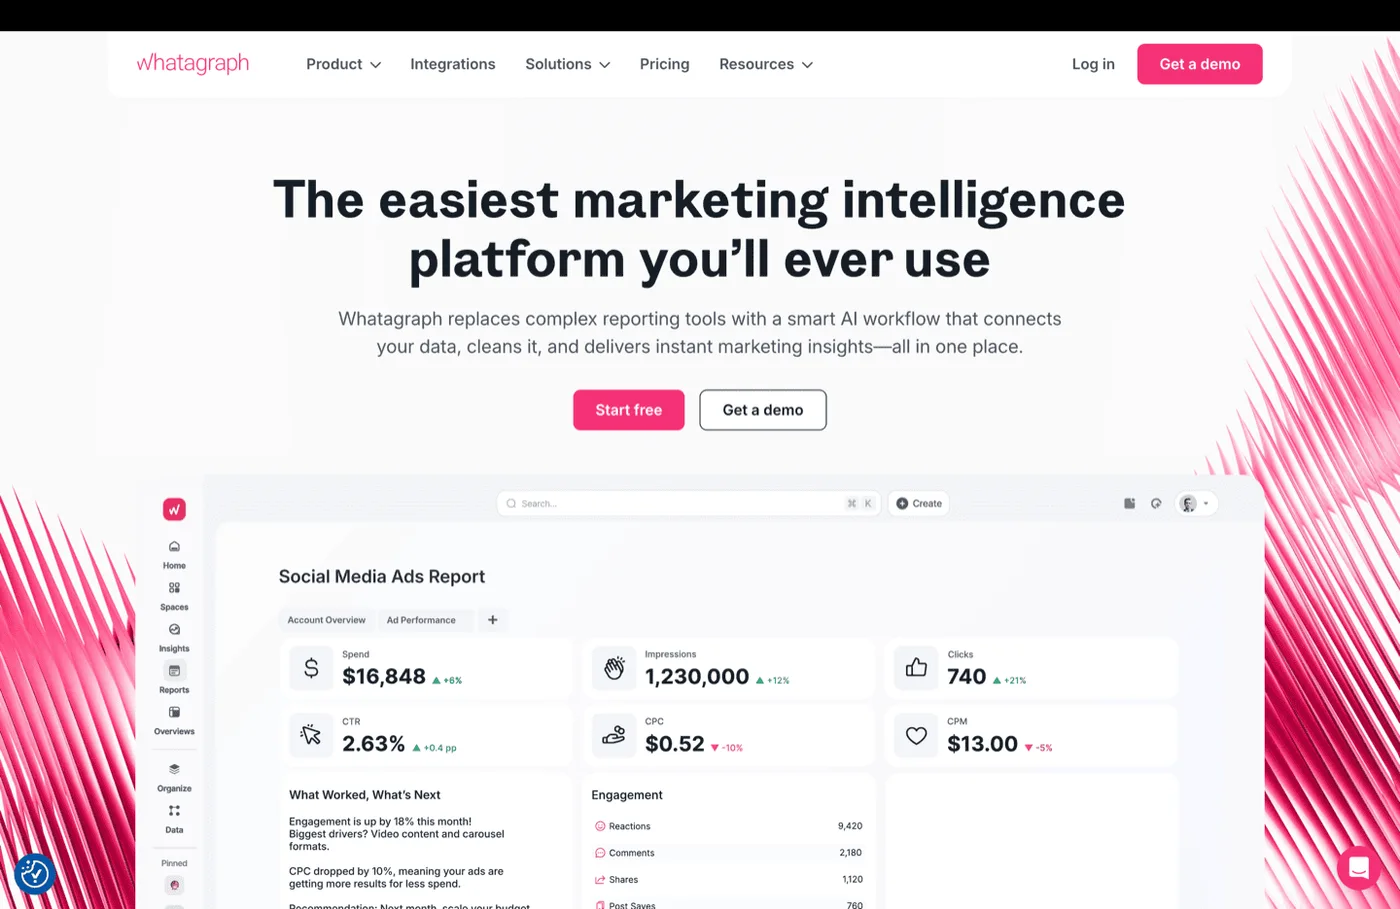
Whatagraph carved out a solid position in the agency reporting market. It connects 55+ marketing data sources, produces white-label dashboards, and automates client-facing PDF reports that agencies can schedule and send without manual work. For teams whose primary job is showing clients what happened last month, it does that job well.
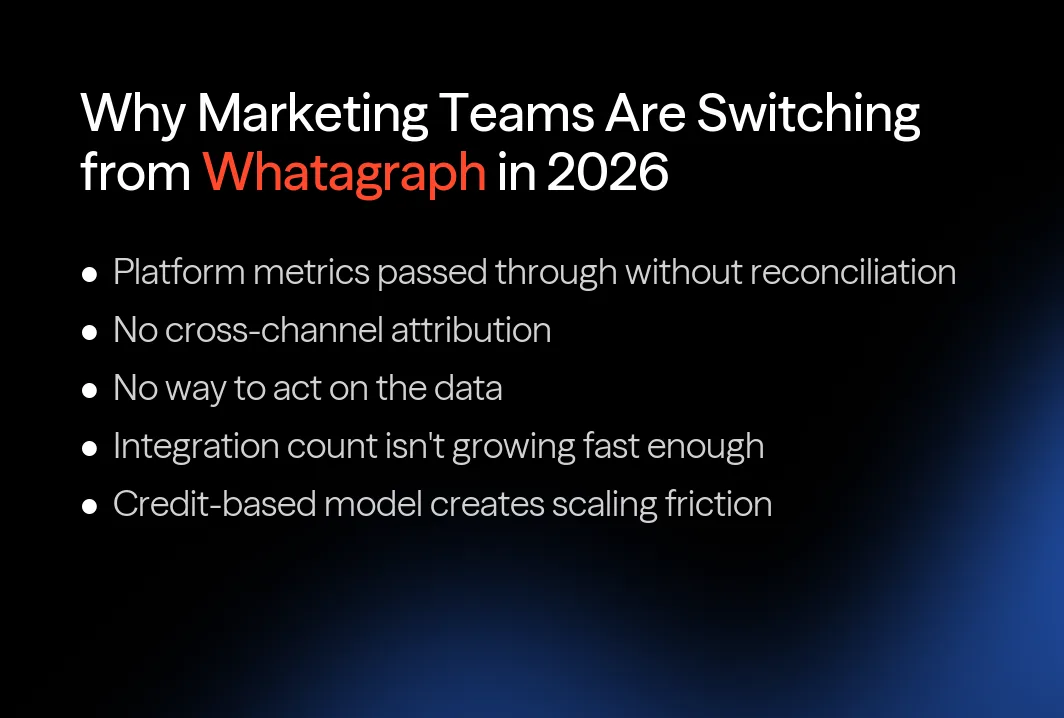
But here's the problem: dashboards that show what happened don't tell you what to do next. Every metric in a Whatagraph report comes directly from the ad platform that generated it — Google's self-attributed conversions, Meta's claimed results, TikTok's engagement numbers. Aggregating those platform-reported metrics into a single view doesn't reconcile the conflicts between them or reveal which channels genuinely drove revenue. More agencies and in-house marketing teams are realizing that polished reports aren't the same thing as actual measurement. The teams searching for a cross-channel reporting platform to replace Whatagraph in 2026 aren't just looking for a cheaper marketing dashboard tool. They're running into specific capability walls that Whatagraph's architecture can't address.
Platform Metrics Passed Through Without Reconciliation
Every ad platform inflates its own numbers. Google claims conversions that Meta also claims. TikTok takes credit for the same purchases. Whatagraph pulls all of these metrics and displays them side by side — but it doesn't reconcile overlapping conversion claims or apply any independent attribution logic. The total "conversions" in a Whatagraph dashboard almost always exceeds actual conversions because the platform never questions the source data. Teams making budget decisions from these numbers are working with inflated inputs.
No Cross-Channel Attribution
Whatagraph has no attribution engine. It can't evaluate the customer journey across channels, assign credit based on actual impact, or show which touchpoints influenced a purchase versus which platforms are simply taking credit. When an agency client asks "which channel is actually driving my sales?" — that question can't be answered inside Whatagraph. It requires a different category of tool entirely.
No Way to Act on the Data
Even if you trust the numbers in your Whatagraph dashboards, there's nothing built in to help you do anything with them. No budget recommendations. No scenario modeling. No diminishing-returns analysis. No automated reallocation. The output is always a report — never a decision. Performance marketers who want to move faster than monthly reporting cycles hit this ceiling hard.
Integration Count Isn't Growing Fast Enough
With 55+ integrations, Whatagraph trails behind most competitors in this article. AgencyAnalytics covers 80+, Supermetrics reaches 130+, and enterprise tools like Funnel.io and Improvado support 500+. Teams with diverse marketing stacks — especially those adding newer platforms like TikTok, Reddit Ads, or emerging commerce channels — find themselves working around missing connectors or waiting for Whatagraph to add support.
Credit-Based Model Creates Scaling Friction
Whatagraph's pricing ties to a credit system where different data sources consume different amounts of credits. Agencies managing multiple clients across many ad accounts find that costs scale unpredictably — a new client with four ad platforms and three analytics accounts burns through credits faster than expected. Several G2 reviewers cite billing surprises as a reason they started looking elsewhere.
How This Comparison Was Created
This comparison evaluates 12 Whatagraph alternatives across measurement capabilities, data integration breadth, reporting and visualization, white-labeling, agency workflow support, scalability, and verified user reviews from G2, Capterra, and TrustRadius. Each tool was assessed based on public product documentation and real user feedback — not vendor marketing claims.
Quick Comparison: 12 Best Whatagraph Alternatives
| # | Platform | Integrations | Attribution | Budget Optimization | White-Label | Pricing |
|---|---|---|---|---|---|---|
| 1 | SegmentStream | Ad platforms, CRMs, warehouses | AI-powered multi-model + incrementality | Yes — automated weekly | No (measurement focus) | Custom |
| 2 | AgencyAnalytics | 80+ | No | No | Yes — full branding | From $79/mo |
| 3 | Supermetrics | 130+ | No | No | No | From ~$37/mo |
| 4 | Funnel.io | 500+ | Early stage (ex-Adtriba) | No | No | From ~$120/mo |
| 5 | Improvado | 500+ | No | No | No | Custom enterprise |
| 6 | Adverity | 600+ | No | No | No | Custom enterprise |
| 7 | Clarisights | 300+ | No | No | No | Custom enterprise |
| 8 | Databox | 130+ | No | No | $200/yr add-on | From $199/mo |
| 9 | DashThis | 34+ | No | No | Yes | From $49/mo |
| 10 | Swydo | 34+ | No | No | Yes | From $69/mo |
| 11 | Porter Metrics | 20+ | No | No | No | From $12.50/mo |
| 12 | Coupler.io | 400+ | No | No | No | From $24/mo |
12 Best Whatagraph Alternatives and Competitors
1. SegmentStream — Best Overall Whatagraph Alternative
Every other tool on this list replaces Whatagraph's dashboard with a different dashboard. SegmentStream replaces the entire approach — starting not with "how do we present data" but with "which marketing channels are actually generating revenue, and where should the budget go next?"
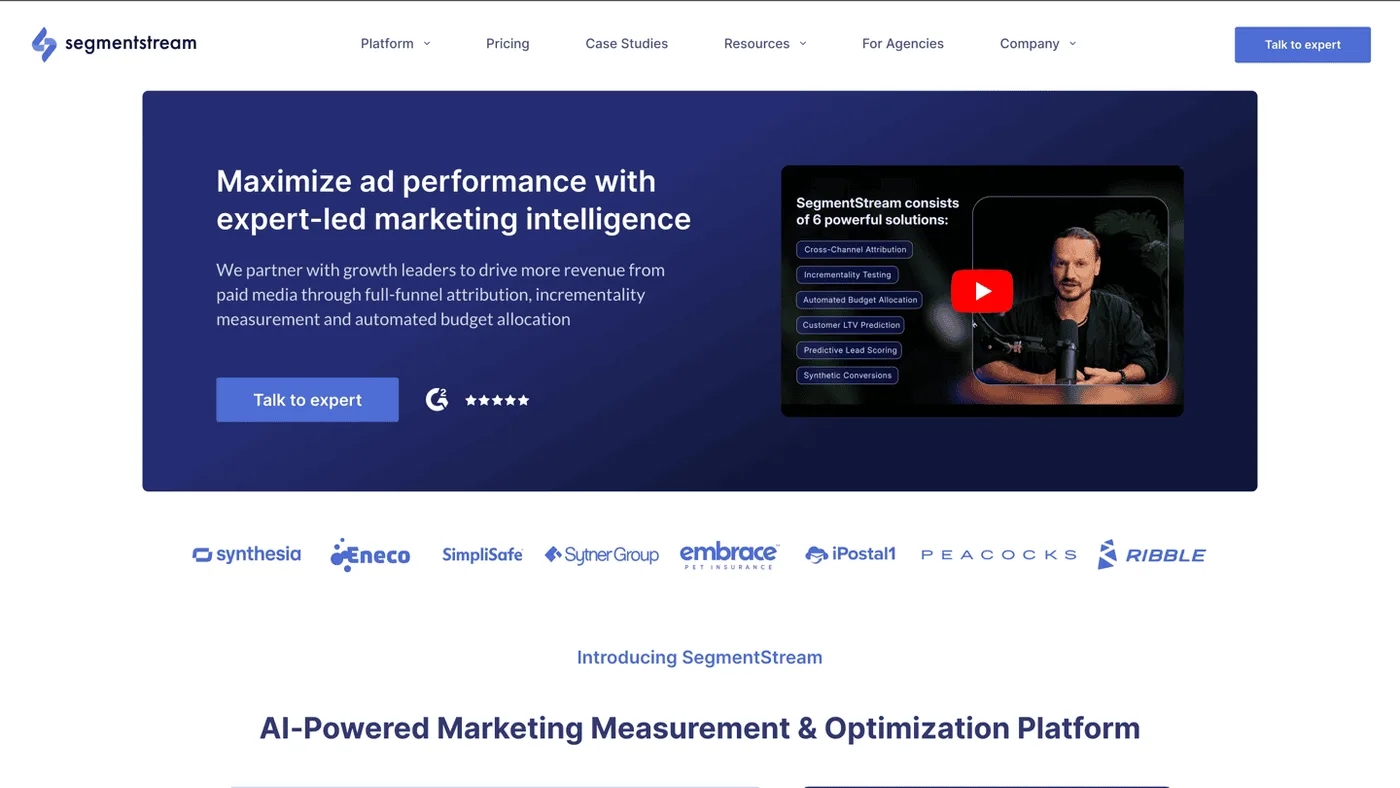
That's a different category of product. Whatagraph aggregates platform-reported metrics into polished reports. SegmentStream collects cross-channel marketing data, runs it through independent attribution models, validates findings with controlled experiments, and then optimizes budgets automatically. The gap between the two isn't a feature comparison — it's an entirely different answer to a different question.
Why SegmentStream Is the Top Whatagraph Alternative
If the reason you're leaving Whatagraph is that dashboards don't tell you what's working, SegmentStream addresses that directly. It's built for performance marketing teams and CMOs at brands spending $50K+/month on paid media who've outgrown reporting-layer tools.
Where Whatagraph passes through platform metrics without questioning them, SegmentStream reconciles conflicting conversion claims across all your ad channels and assigns credit based on measured behavioral impact. Where Whatagraph ends at a PDF, SegmentStream produces weekly budget reallocation recommendations — and can execute them automatically across your ad platforms.
Key Capabilities
1. Cross-Channel Attribution With Multiple Models
SegmentStream offers a suite of attribution models: first-touch, last paid click, last paid non-brand click, and customizable multi-touch attribution. The ML model evaluates behavioral signals within each session — engagement depth, key events, navigation patterns — and assigns credit based on each touchpoint's actual incremental impact on conversion probability. This is a completely different methodology from the platform-reported numbers that Whatagraph displays, which rely on each ad platform's self-interested attribution window.
2. Incrementality Testing That Proves What Works
Attribution distributes credit. Incrementality testing answers a harder question: did this channel drive revenue that wouldn't have happened without it? SegmentStream runs expert-led geo holdout experiments with MDE and power analysis, synthetic control groups, and confidence intervals. The results are CFO-defensible — not black-box claims from an ad platform.
3. Marketing Mix Optimization That Moves Budgets
This is where SegmentStream breaks completely from the Whatagraph category. The platform models marginal returns and diminishing returns per campaign, forecasts optimal cross-channel budget scenarios, and recommends precise reallocations weekly. Then it can automatically apply those changes across your ad accounts. Budgets shift based on real-time efficiency data — not a quarterly planning deck built from stale Whatagraph reports.
4. AI-Powered Budget Execution
The Continuous Optimization Loop (Measure, Predict, Validate, Optimize, Learn, Repeat) operates as an agentic AI framework. It doesn't wait for a human analyst to interpret a dashboard and file a Jira ticket. It autonomously identifies underperforming campaigns, models reallocation scenarios, and executes approved budget changes across platforms.
5. Agentic AI-Ready — MCP Server
SegmentStream's MCP Server connects the measurement engine directly to AI assistants like Claude, ChatGPT, and Gemini. Performance marketers can query attribution data, run scenario analyses, and trigger budget optimizations through natural language — turning what used to be a weekly reporting ritual into an autonomous workflow.
Strengths
- Independent measurement across channels — Reconciles overlapping conversion claims from Google, Meta, TikTok and every other platform instead of displaying each platform's self-attributed numbers
- Closed-loop from measurement to action — The only tool on this list that goes from data collection through attribution, incrementality validation, and automated budget execution in one platform
- Conversion Modeling for privacy gaps — Recovers attribution for users who decline tracking consent using GDPR-compliant probabilistic inference, so budget decisions aren't based on a shrinking data sample
- Expert-led partnership model — Dedicated team with Slack access and monthly performance reviews, not a self-serve dashboard you're left to figure out alone
- Transparent, explainable methodology — Every measurement decision can be traced back to its inputs. Built for CFO-level scrutiny
Limitations
- Minimum ad spend threshold — Designed for brands spending $50K+/month on paid media. Smaller agencies or low-spend accounts won't qualify
- Premium investment — Custom pricing with a strategic partnership model. This is a committed engagement, not a month-to-month SaaS subscription
Target market: Performance marketers and CMOs at brands spending $50K–$1M+/month on digital advertising who need to understand which channels drive incremental revenue and where budgets should move next.
G2 rating: 4.7/5
Customer review examples:
"SegmentStream has completely changed the way we look at the efficiency of our marketing campaigns." — G2 Review
"The team is very responsive and always ready to help." — G2 Review
Summary
SegmentStream is the only Whatagraph alternative that answers the question Whatagraph can't: which marketing channels are actually driving revenue, and what should we do about it? For teams that have outgrown the reporting layer and need measurement that leads directly to budget optimization, it's the complete solution.
2. AgencyAnalytics
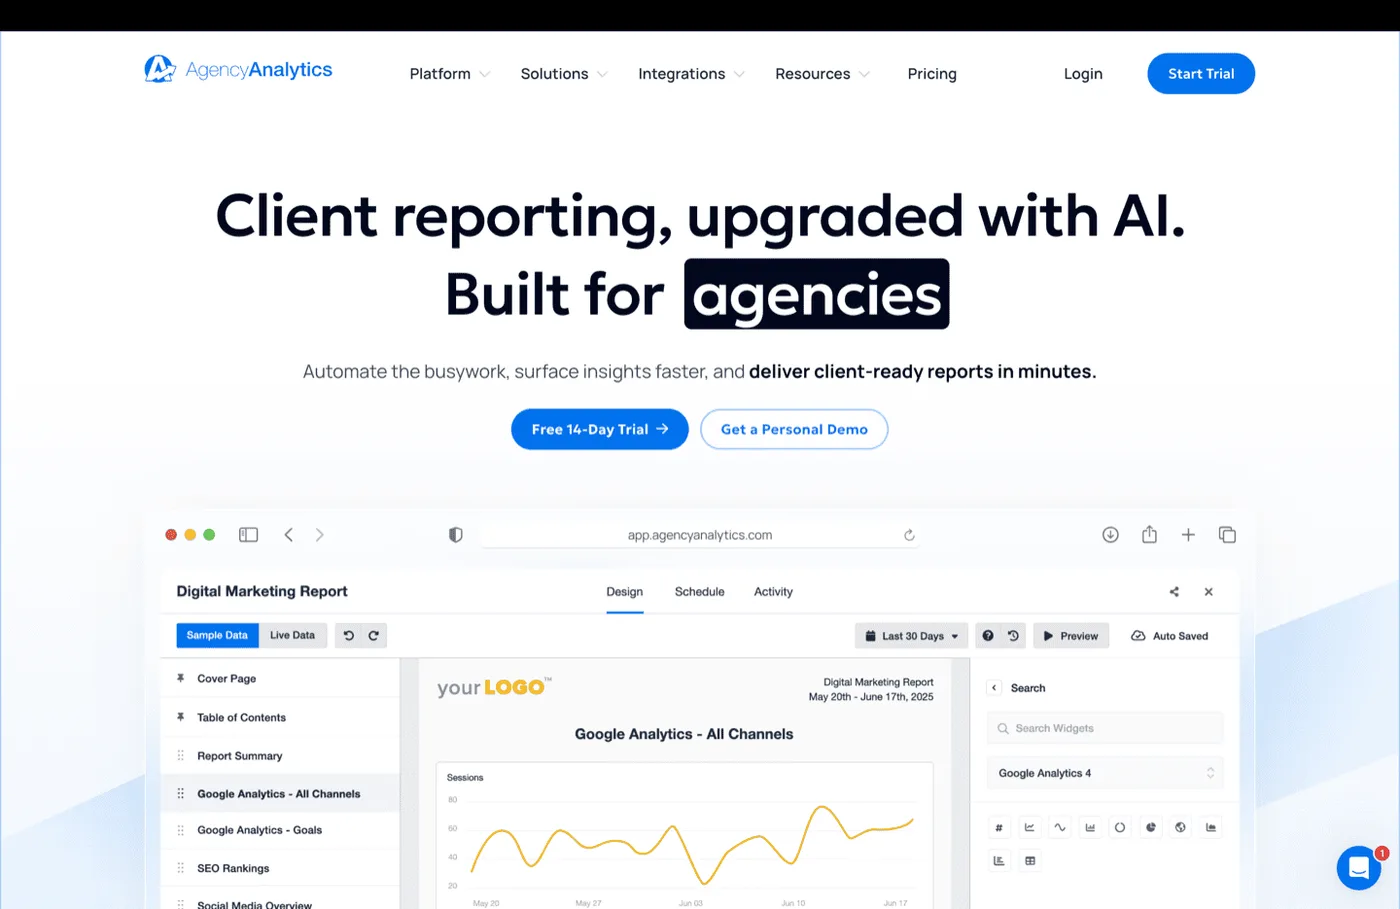
For agencies managing a roster of clients who each expect a monthly performance report, AgencyAnalytics is the tool that comes up in almost every Whatagraph comparison. It's the closest direct competitor in terms of what it does and who it serves.
Core Capabilities
- 80+ integrations included on every plan — no per-integration surcharges
- White-label dashboards with full branding control: custom domains, logos, colors, email templates
- Built-in SEO toolkit — daily rank tracker, backlink checker, and site auditor alongside marketing reporting
- AI Summary generates automated performance narratives from dashboard data, saving time on monthly client reviews
- Task management for client deliverables built directly into the reporting workflow
- 24/7 live chat support on every plan, not just premium tiers
Strengths
- Broader integration coverage than Whatagraph — 80+ versus Whatagraph's 55+, with no additional cost per connector
- SEO tools reduce tool sprawl — Agencies running both reporting and SEO campaigns consolidate into one platform instead of paying for separate rank trackers
- Per-client billing keeps small agencies organized — Each client gets dedicated dashboards, access controls, and task tracking in one compartment
- Strong review scores — G2: 4.7/5 (400+ reviews), Capterra: 4.8/5
Limitations
- Per-client pricing escalates at scale — Costs climb steadily once you pass 20+ clients. Agencies with large rosters face significant monthly bills
- Integration reliability gaps — G2 reviewers report connections dropping unexpectedly, requiring manual reconnection. A known issue across multiple review platforms
- Limited data transformation — Pulls platform data as-is without normalization. Naming mismatches and currency differences aren't resolved automatically
- Weaker customization for complex metrics — Advanced calculated fields or multi-source blending require workarounds that more technical platforms handle natively
Target market: Small-to-mid-size digital marketing agencies managing 5–50+ client accounts who need polished, white-label reporting alongside built-in SEO tools.
Summary
AgencyAnalytics covers the agency reporting use case with more integrations and SEO tools than Whatagraph offers. It doesn't attempt measurement, attribution, or optimization — it's a reporting tool, and it knows it. The per-client billing model works well up to a certain scale, then becomes a real cost consideration.
3. Supermetrics
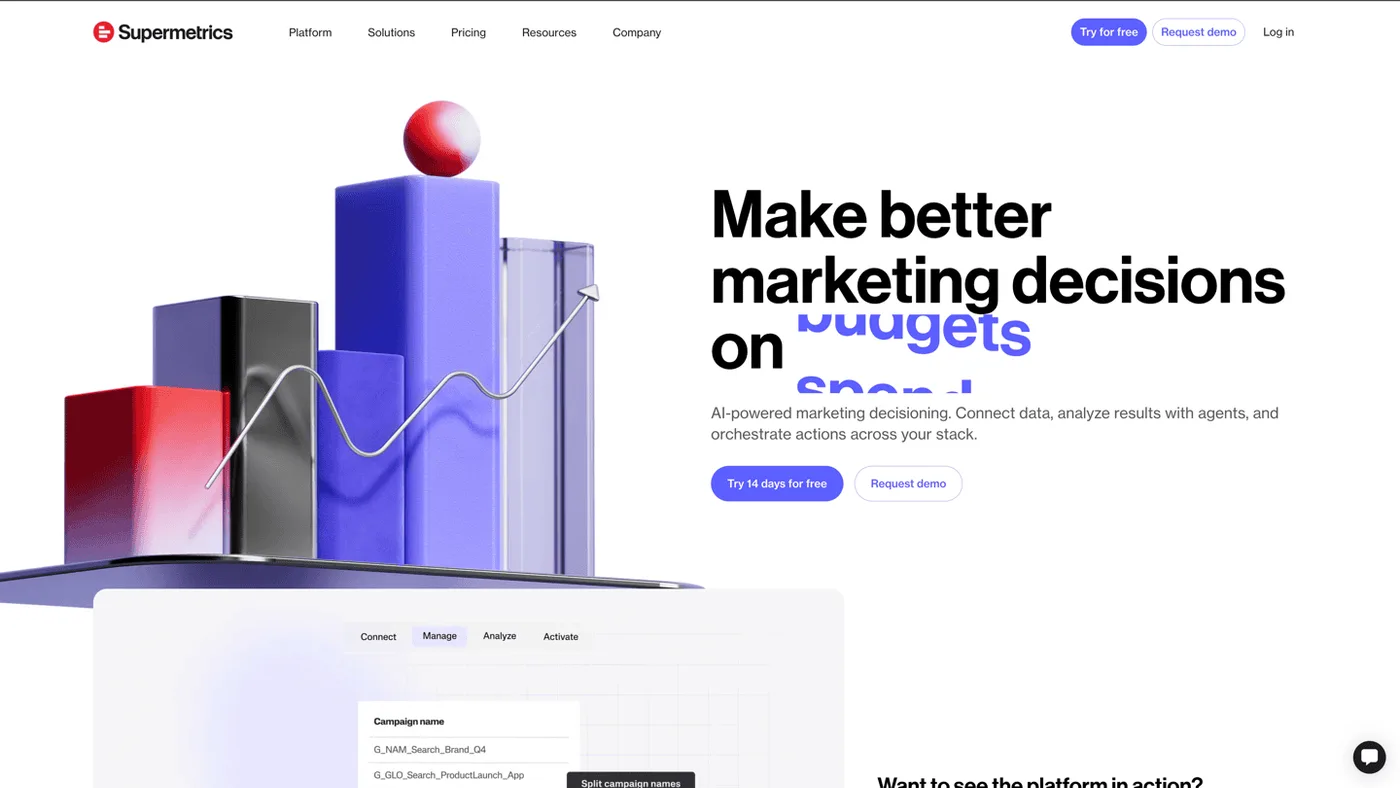
Where Whatagraph tries to own the dashboard, Supermetrics takes the opposite approach: it pulls data and puts it wherever you already work. Google Sheets, Excel, Looker Studio, BigQuery — Supermetrics is a connector, not a destination. For teams that already have a reporting tool they like and just want better data access, that's a meaningful difference. For a deeper comparison, see our Supermetrics alternatives guide.
Core Capabilities
- 130+ marketing platform connectors — covers most standard marketing stacks without add-ons
- Native destinations include Google Sheets, Excel, Looker Studio, BigQuery, Snowflake, and other warehouses
- Scheduled data pulls that refresh automatically on your chosen interval
- Query builder for custom data extractions without SQL
Strengths
- Quick setup — Connect accounts, set a schedule, and platform data starts flowing into your destination within minutes
- Accessible for non-technical users — The Google Sheets and Looker Studio integrations mean marketers don't need data engineering support to get started
- Affordable entry point — Starting around $37/month for basic use, a much lower commitment than most dashboard platforms in this space
- 130+ connectors covers most standard marketing stacks — Out-of-the-box coverage means fewer gaps when onboarding clients with diverse platform mixes
Limitations
- Extract-load only with no transformation — Raw platform data arrives with naming mismatches, inconsistent date formats, and duplicate records. Someone has to clean it manually
- Silent connector failures — Data stops flowing without alerts. Teams discover stale reports days after a breakage, a pattern repeatedly flagged on G2 and Trustpilot
- Platform metrics passed through unchanged — Google says 47 conversions, Meta says 38, and Supermetrics delivers both numbers without reconciliation. Overlapping claims go unquestioned
- Breaks down at scale — Built for quick pulls, not governed enterprise data flows. Teams with 50+ data sources find reliability and management issues compounding
Target market: Marketing managers and analysts at SMBs and agencies who need quick, affordable data extraction into tools they already use — Google Sheets, Looker Studio, or a data warehouse.
Summary
Supermetrics trades Whatagraph's visual polish for raw flexibility. You get more connectors at a lower price, but you lose the built-in dashboards and white-labeling. The data arrives raw and unprocessed, which is fine for teams that have their own reporting infrastructure. It doesn't attempt any form of independent measurement or channel optimization.
4. Funnel.io
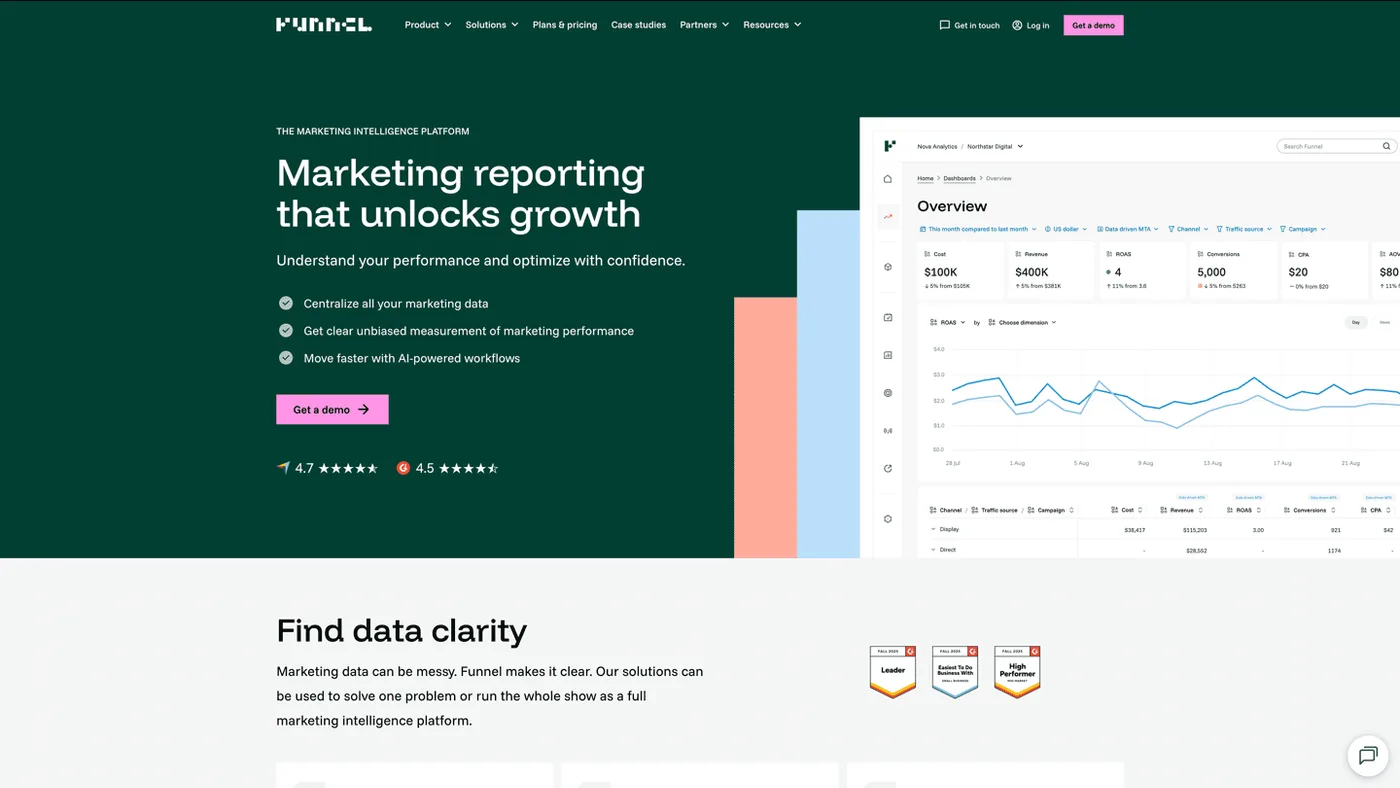
Switching from Whatagraph to Funnel.io represents a category shift — from a reporting tool to a marketing data platform. Funnel doesn't produce client-facing dashboards or white-label PDFs. Instead, it solves the messy middle layer: collecting data from 500+ sources, normalizing naming conventions and currencies, storing historical data in its managed Data Hub, and delivering clean datasets to wherever your BI team needs them. For a full comparison, see Funnel.io alternatives.
Core Capabilities
- 500+ marketing data connectors with built-in normalization for naming, currency, and date format conflicts
- Managed Data Hub stores and versions historical marketing data without re-pulling from APIs
- Flexible export to Looker, Tableau, BigQuery, Snowflake, Power BI, and more
- Enterprise governance — multi-region, multi-brand support with compliance controls
Strengths
- Normalization built into the pipeline — Handles the naming mismatch and currency conversion problems that Whatagraph and Supermetrics leave for you to solve manually
- Historical data storage — Data Hub retains versioned records so teams can run historical comparisons without worrying about API retention limits
- Scale designed for enterprise — Multi-brand, multi-region architectures work out of the box, not bolted on after the fact
- Broad connector library — 500+ sources covers almost any marketing platform combination
Limitations
- Adtriba acquisition still maturing — Funnel Measurement (formerly Adtriba) is available, but the measurement capabilities aren't production-ready for complex multi-channel budget decisions yet
- Data layer without a decision layer — Cleans and delivers data effectively but won't tell you which campaigns drove incremental results or where budgets should shift
- Data discrepancy reports from users — Normalized figures sometimes diverge from source platform numbers, requiring manual reconciliation
- Complex mapping for non-standard setups — Custom campaigns or unusual naming conventions require iterative configuration work
Target market: Enterprise marketing and analytics teams that need clean, governed data flowing into BI infrastructure — particularly organizations with multi-brand or multi-region complexity.
Summary
Funnel.io solves the data quality problem that sits between Whatagraph's raw data and meaningful analysis. It won't produce the dashboards or client reports Whatagraph does, but it delivers substantially cleaner data to whatever visualization layer a team already uses. The measurement gap remains open — Funnel collects and normalizes but doesn't interpret.
5. Improvado
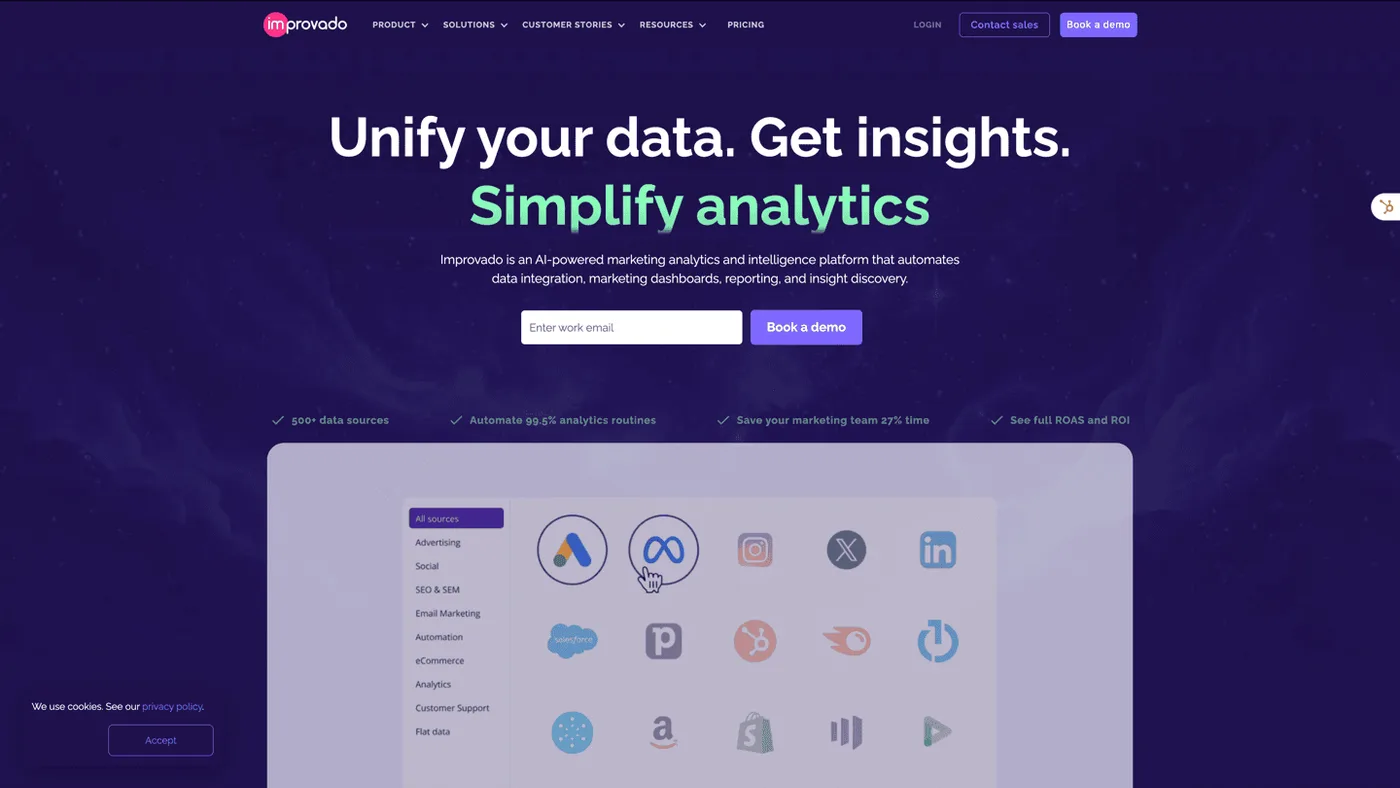
The platform positions itself as an enterprise marketing data solution with full ETL — extract, transform, load — which puts it in a different weight class than Whatagraph's reporting-focused approach. For more context, see our Improvado competitors guide.
Core Capabilities
- 500+ connectors across ad platforms, CRMs, analytics tools, and marketing platforms
- True ETL with governance — validation rules, transformation logic, audit trails, and role-based access
- Enterprise architecture — multi-region, multi-brand, multi-agency support with SOC 2 certification
- AI Agent for natural-language data querying across connected sources
Strengths
- Data quality controls baked into the pipeline — Validation rules and transformation logic catch issues before data reaches downstream tools. A meaningful upgrade over Whatagraph's raw pass-through
- Built for organizational complexity — Multi-region setups with different brands, agencies, and access levels are supported natively, not treated as edge cases
- SOC 2 certified — Meets enterprise compliance requirements that smaller reporting tools can't address
- AI-powered data querying — Natural-language interface lets non-technical marketers ask questions across datasets without SQL
Limitations
- Heavy implementation — Typical onboarding takes around two months and needs dedicated analyst or data engineering resources. A significant step up from Whatagraph's self-serve setup
- Data infrastructure without a decision layer — 500+ connectors and strong transformation logic, but no attribution modeling, causal measurement, or spend recommendations. You get governed data without the "what to do with it" answer
- Annual enterprise contracts — Long-term commitments that don't suit teams wanting flexibility or shorter evaluation periods
Target market: Enterprise marketing operations teams at large brands or global agencies with complex data stacks, multiple regions, and strict compliance requirements.
Summary
Improvado handles the data plumbing at enterprise scale — governance, validation, multi-region complexity — with more rigor than Whatagraph offers. The trade-off is implementation time, cost, and the fact that even with perfect data, Improvado doesn't measure marketing effectiveness or suggest what to change.
6. Adverity
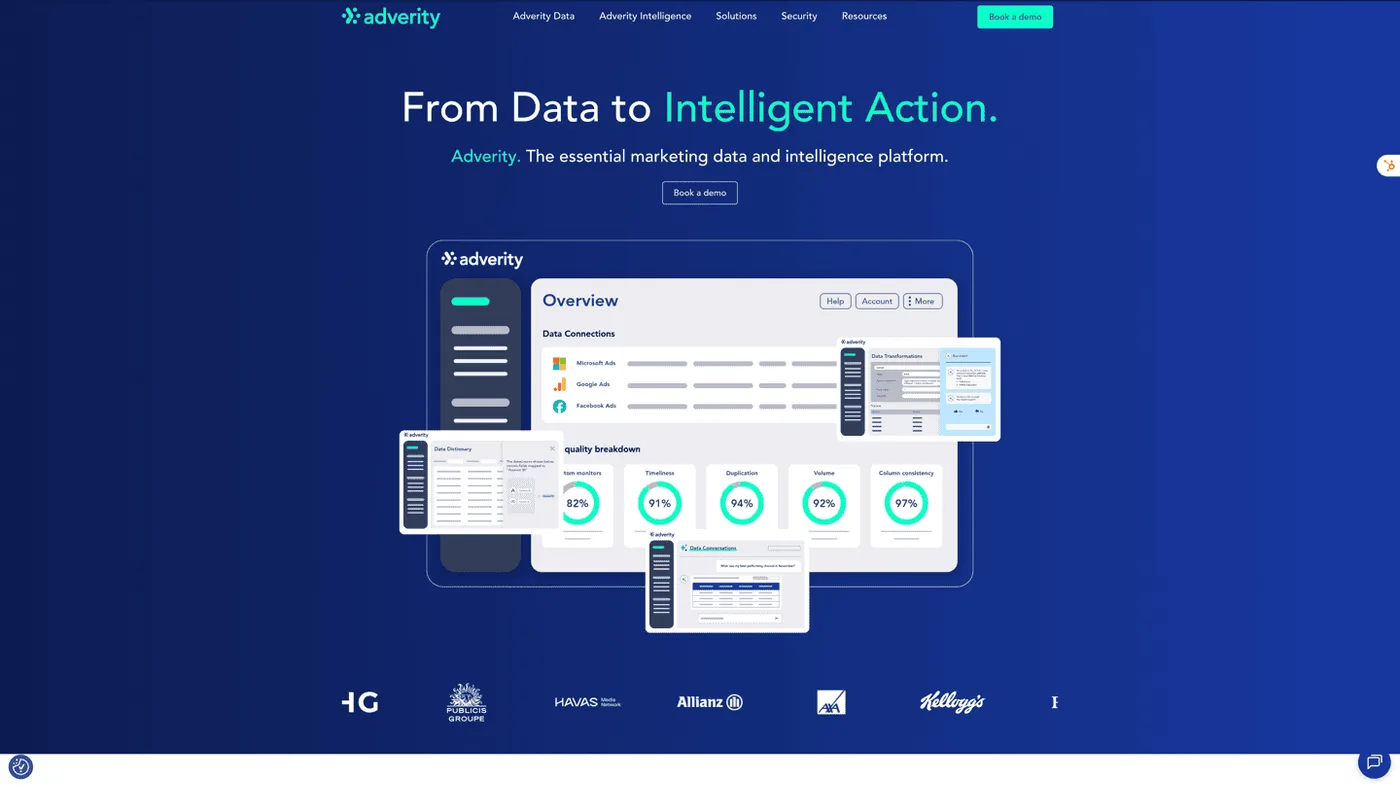
Where Improvado focuses on governance, Adverity focuses on connector breadth and AI-powered data transformation. With 600+ source connectors, Adverity targets global enterprises with decentralized marketing organizations that struggle to bring fragmented data into a unified view. For a detailed comparison, see Adverity alternatives.
Core Capabilities
- 600+ source connectors — covers niche platforms alongside major ones
- AI-powered data transformation that automates mapping, harmonization, normalization, and quality checks
- Enterprise compliance certifications — ISO 27001, SOC 2 Type II, GDPR
- Multi-region and multi-agency governance for decentralized marketing orgs
Strengths
- Automated harmonization at scale — AI-driven mapping reduces manual configuration for organizations with hundreds of data sources and inconsistent naming conventions
- Compliance stack built for regulated industries — Triple certification (ISO 27001 + SOC 2 Type II + GDPR) satisfies even the most demanding enterprise security reviews
- Multi-agency governance handles decentralized structures — Global brands working with regional agencies get centralized data control without forcing uniform workflows
- 600+ connectors covers niche platforms alongside major ones — Reaches sources that smaller tools haven't built integrations for
Limitations
- Steep learning curve with significant configuration overhead — No free trial available. Teams invest considerable setup time before seeing value
- No built-in BI layer — Requires separate Tableau, Looker, or Power BI for marketer-facing output. A step backward from Whatagraph's native reporting
- Data collection and transformation without interpretation — Harmonizes data across sources but doesn't reveal which campaigns worked, why, or what budget changes would improve performance
- Premium enterprise pricing with long-term contracts — Contact sales for pricing. Represents a different budget conversation than Whatagraph
Target market: Enterprise marketing operations at global brands with decentralized, multi-region marketing data needs and strict compliance requirements.
Summary
Adverity focuses on bringing order to chaotic, globally distributed marketing data. The AI-powered harmonization is useful for organizations drowning in naming inconsistencies across dozens of markets. It doesn't produce dashboards (you'll still need BI tools) and it doesn't produce insights about what's working or what to change.
7. Clarisights
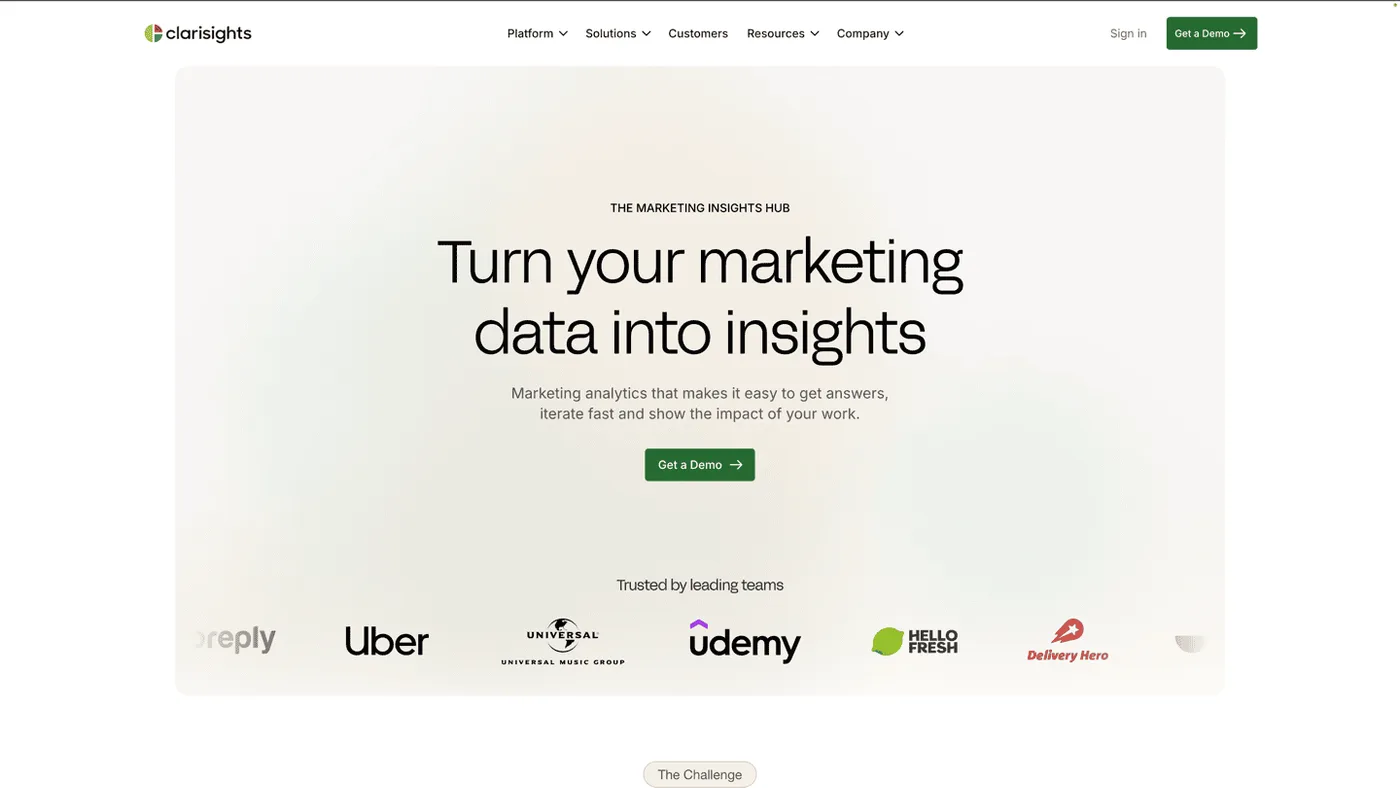
Most marketing analytics platforms force a choice: either the data team builds custom dashboards (slow), or marketers use pre-built templates (limited). Clarisights tries to eliminate that trade-off by giving performance marketers the ability to build their own cross-channel analytics views — from high-level channel mix down to individual creative performance — without SQL or data team involvement.
Core Capabilities
- Self-service analytics — marketers build dashboards independently, without filing tickets or waiting for analyst support
- 300+ native API integrations with automatic data joining and normalization
- Creative-level drill-down from cross-channel overview to individual ad performance in a single view
- Enterprise security — ISO 27001, SOC 2 Type II, GDPR compliant
Strengths
- True self-service for marketers — Performance marketing teams build and modify analytics views on their own schedule, not the data team's roadmap. G2 users consistently highlight the speed of self-service exploration: "I can answer my own questions in minutes instead of waiting days for a data team ticket." That workflow independence is the primary reason teams switch from tools like Whatagraph where dashboard changes require support intervention.
- Granular cross-channel analytics — The drill-down from channel-level spend to individual creative-level metrics happens in a single interface, without switching tools or running exports. Teams can spot which specific creatives drive performance across channels, then pivot immediately to campaign-level views — deep creative-level detail that most marketing dashboard tools don't support natively.
- Enterprise-grade security certifications — ISO 27001, SOC 2 Type II, and GDPR compliance satisfy enterprise procurement requirements
- Strong G2 user ratings in the enterprise marketing analytics category — Verified user reviews validate the self-service claim with real-world usage data
Limitations
- Enterprise-only access — No self-serve tier, no free trial, no transparent pricing. Every evaluation starts with a sales conversation, which slows down teams that want to test before committing
- Visualization scope without an action layer — Effective at showing cross-channel performance, but insights remain in the team's heads. No automated optimization or budget recommendations
- Not data infrastructure — Doesn't move data to warehouses like BigQuery or Snowflake. Teams that need both analytics and a data pipeline will need separate tools
- Analysis depends entirely on user interpretation — Presents data clearly but the "what should we do?" step is manual
Target market: Enterprise performance marketing teams at DTC brands and tech companies that want deep, creative-level analytics without depending on data engineering support.
Summary
Clarisights removes the bottleneck between performance marketers and their data. For teams that have the analytical skill to interpret what they see and translate it into action manually, that's valuable. The platform stops at visualization — it shows what happened at deep creative-level detail but leaves the "what to do next" question unanswered.
8. Databox
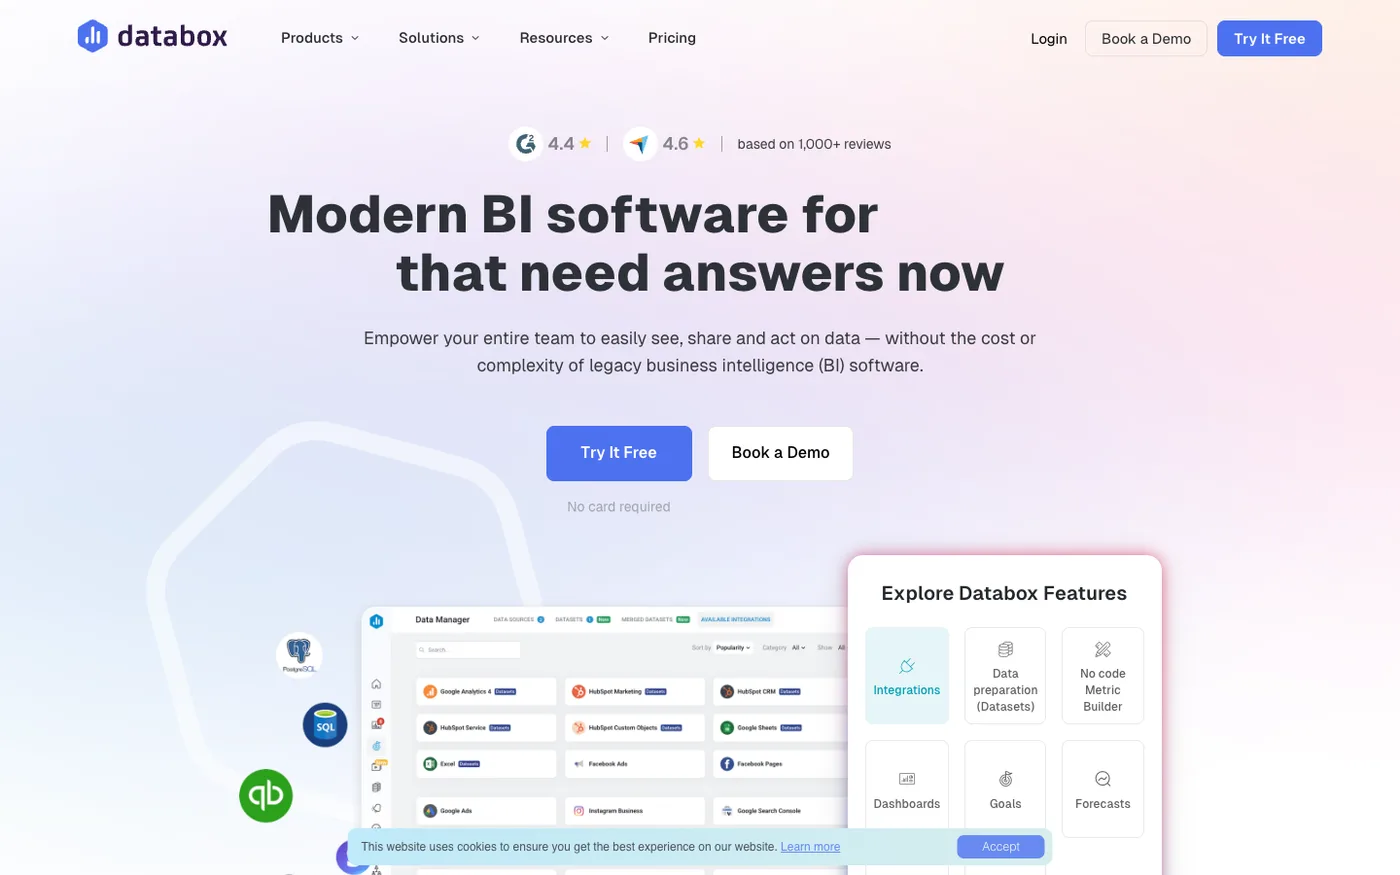
Whatagraph serves agencies producing client reports. Databox serves a different audience: in-house marketing teams tracking their own KPIs. The product is designed around goal monitoring, progress alerts, and mobile-friendly marketing data visualization tools that let managers check performance during a commute, not just during a Monday morning meeting.
Core Capabilities
- 130+ data source integrations covering marketing platforms, CRMs, databases, and SaaS tools
- Genie AI analyst provides automated performance summaries and trend explanations
- Goal tracking with alerts — set targets for any metric and get notified when progress stalls
- Mobile-optimized dashboards — Strong native mobile experience and one of the few reporting tools built for phone-first usage
- Unlimited users on all plans — no per-seat pricing
Strengths
- Goal-centered approach changes the conversation — Instead of "here's what happened," Databox frames everything around "are we on track?" — a subtle but meaningful difference for in-house teams with defined targets
- Mobile experience that actually works — Most reporting tools treat mobile as an afterthought. Databox built for it, useful for executives who check numbers between meetings
- Unlimited users at every tier — No per-seat billing means the whole team can access dashboards without cost anxiety
- Genie AI generates context automatically — Summarizes trends and anomalies without manual analysis. Saves time on routine check-ins
Limitations
- Data source restrictions on lower plans — Professional plan ($199/month) includes only 3 data sources. Multi-channel marketing teams hit this cap immediately, and additional sources carry extra cost
- Widget reliability concerns — G2 reviewers report dashboard widgets freezing, defaulting to wrong accounts, or stopping data pulls for weeks before resolution
- White-labeling costs extra — $200/year add-on, where competitors like AgencyAnalytics and DashThis include it in standard plans
- Data stays inside Databox — Not exportable to warehouses or BI tools. What goes in doesn't come out in a usable format for downstream analysis
Target market: SMBs and growing in-house marketing teams that need centralized KPI visibility and progress tracking across multiple tools.
Summary
Databox reframes reporting around KPI progress and goal tracking rather than raw data display. It's built for in-house teams, not agencies. The 3-data-source limit on the Professional plan is a real constraint for multi-channel marketing teams, and the lack of data portability limits its utility beyond dashboard monitoring.
9. DashThis
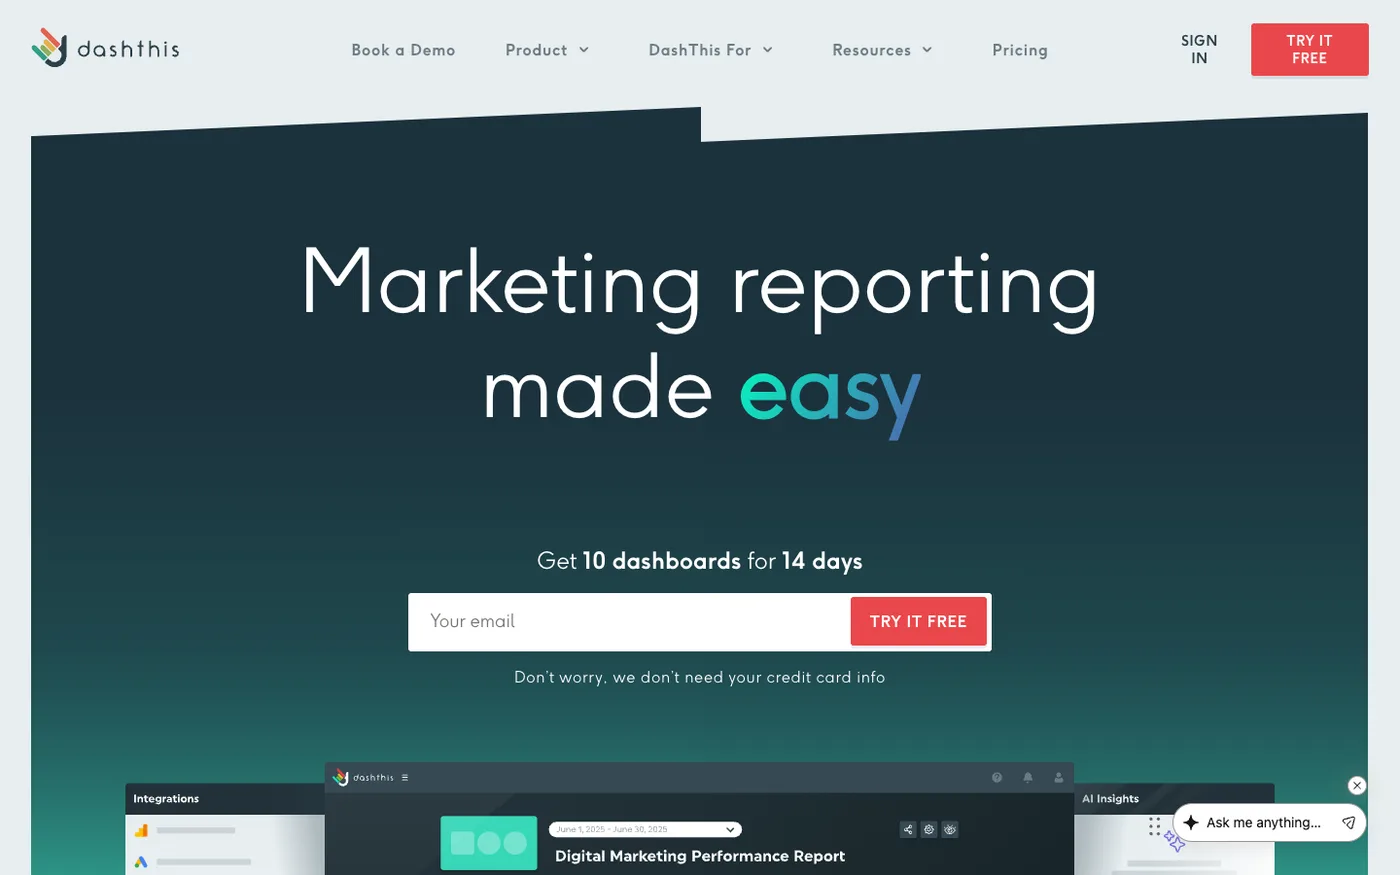
Speed and simplicity. That's the pitch, and DashThis delivers on it. For small agencies that need to stand up professional-looking dashboards quickly without configuring complex data pipelines, DashThis strips away everything that isn't dashboard creation and report delivery. All features ship at every pricing tier — no feature-gating surprises as you scale.
Core Capabilities
- Pricing based on dashboard count — Unlimited data sources on all plans with no per-source charges
- 34+ native integrations covering major marketing and advertising platforms
- Dedicated account manager on every plan, including the lowest tier
- White-label reporting with custom branding across all dashboards and emails
- Template library for quick dashboard creation from pre-built layouts
Strengths
- All features at every price tier — No "upgrade to unlock" friction. The $49/month plan has the same functionality as the $739/month plan, just fewer dashboards
- Dedicated account manager included — Unusual at this price point. Most competitors reserve dedicated support for enterprise plans
- Fast time-to-dashboard — Templates and drag-and-drop interface mean new client dashboards go live in minutes, not hours
- Unlimited data sources per dashboard — Connecting multiple platforms to a single dashboard doesn't increase cost
Limitations
- Only 34 native integrations — Substantially fewer than Whatagraph (55+), AgencyAnalytics (80+), or Supermetrics (130+). Agencies with clients on niche or emerging platforms may find gaps
- Dashboard count drives pricing — Agencies with many clients face costs climbing to $739/month for unlimited dashboards. The per-dashboard model that feels cheap with 5 clients gets expensive at 40
- Limited data blending and cross-channel analysis — Basic comparisons work, but complex multi-source transformations or weighted calculations aren't feasible
- Designed for small agency workflows only — No data export to warehouses, no advanced analytics, no API for custom integrations beyond what's built in
Target market: Small agencies and freelancers managing 5–20 client reporting accounts who value speed, simplicity, and having every feature available from day one.
Summary
DashThis serves agencies that want a short path from connected data to finished client report. It trades depth and integration breadth for speed and simplicity. Teams that need advanced analytics, broad connector coverage, or data infrastructure will outgrow it quickly.
10. Swydo
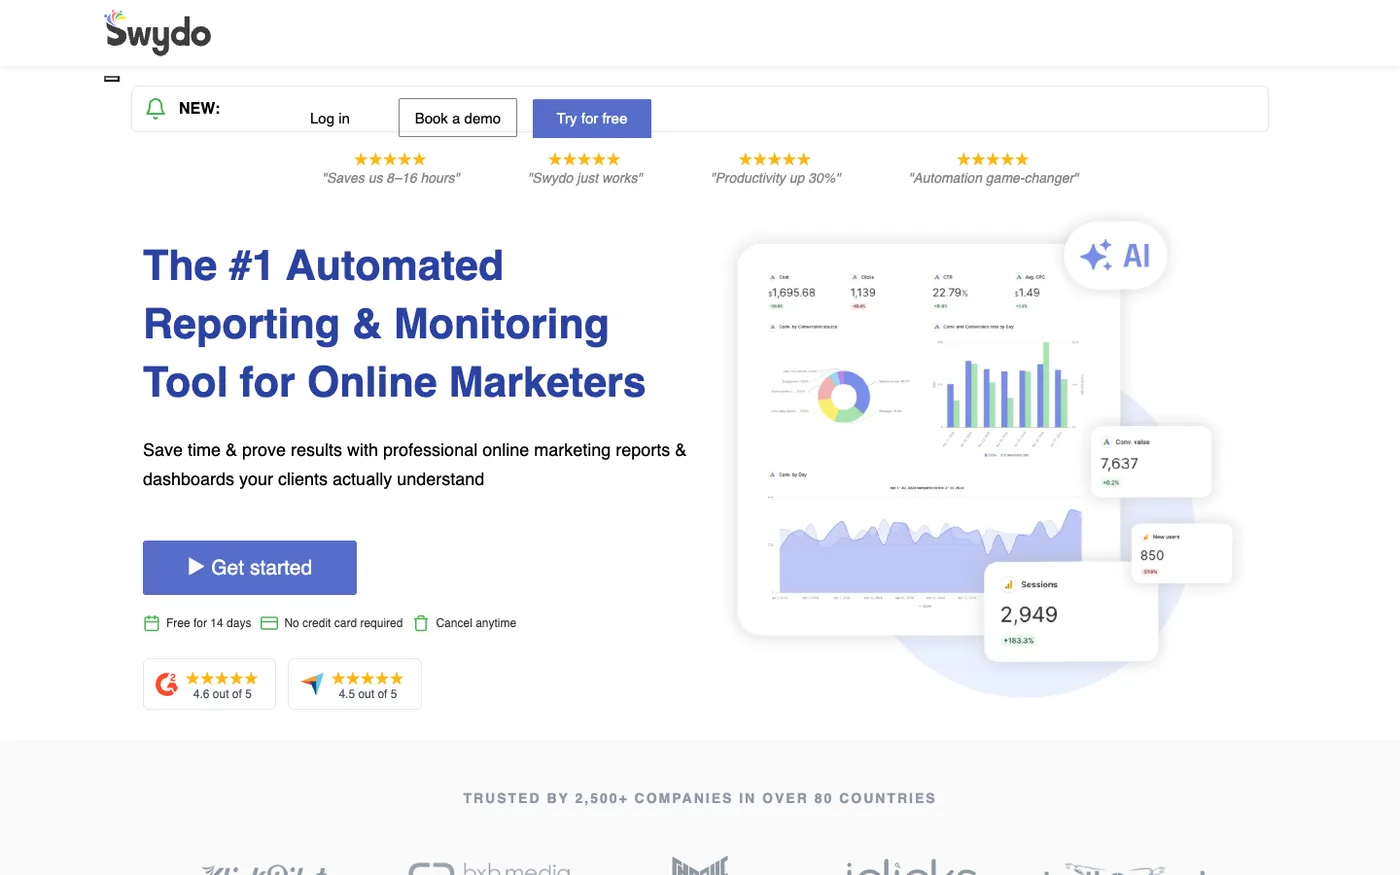
Swydo competes for the same small-agency audience as DashThis but takes a different pricing approach. Instead of charging per dashboard, Swydo charges per data source account — each Google Ads account, each Meta Ads account, each GA4 property counts as a separate billing unit. For agencies with clients who run fewer platforms, that model works out cheaper. For agencies with clients running five or six platforms each, it gets expensive fast. Here's what that looks like in practice: a 15-client agency where each client has Google Ads, Meta Ads, and GA4 connected uses 45 of Swydo's data source slots. At the base plan's 10-source limit ($69/month), that agency needs the $249/month tier just to cover connections — before adding any optional sources for LinkedIn, TikTok, or Bing.
Core Capabilities
- Source-based pricing starting at $69/month for 10 data source accounts
- Automated report scheduling with personalized email delivery (custom logos, signatures)
- White-labeling included on all plans — custom branding without add-on fees
- Reporting API for custom integrations and automated workflows
- 34+ data source integrations covering core marketing and analytics platforms
Strengths
- Transparent, predictable pricing for small stacks — The per-source model is easy to forecast when clients have 2-3 platforms each. No surprises on the monthly bill
- Automated report delivery with personal touches — Scheduled emails with custom signatures and logos make reports feel hand-crafted even when they're fully automated
- White-labeling on every plan — Included from the lowest tier, unlike competitors that gate it behind premium plans or charge add-on fees
- Simple interface with minimal learning curve — New team members can produce client-ready reports within their first day
Limitations
- Per-source pricing compounds for complex clients — Each ad account counts separately. A client with Google Ads, Meta Ads, GA4, LinkedIn Ads, and Google Search Console consumes 5 of your 10 included sources
- Only 34+ integrations — Narrower than Whatagraph (55+) and much narrower than AgencyAnalytics (80+). Niche platform coverage is thin
- Missing features reported by users — G2 reviews (6 out of 27) flag limited customization options and the absence of advanced analytics capabilities
- Built for small-scale operations — Agencies managing 30+ clients with diverse platform stacks will outgrow Swydo's integration limits and pricing economics
Target market: Small digital marketing agencies (1–10 people) that prioritize automated report delivery and white-labeling on a controlled budget.
Summary
Swydo serves agencies where reporting efficiency and budget predictability matter more than integration depth or analytical capability. The per-source pricing model is a strength at small scale and a constraint at larger scale. Measurement, attribution, and optimization aren't part of the product scope.
11. Porter Metrics
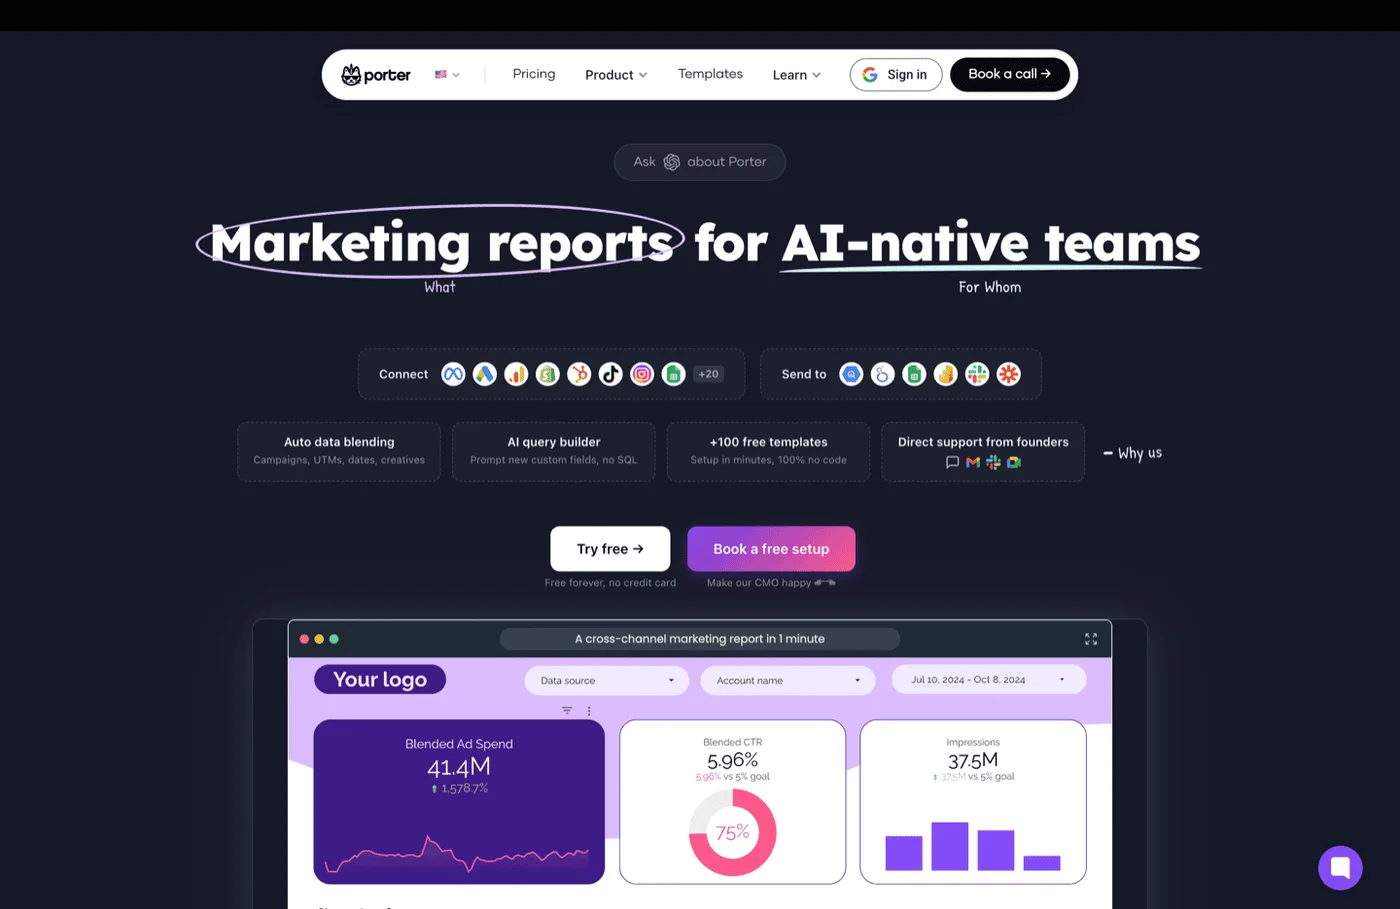
Teams already committed to Google's reporting stack — Looker Studio for dashboards, Google Sheets for ad-hoc analysis, maybe BigQuery for storage — don't always need a full reporting platform. Porter Metrics is a no-code connector that bridges marketing platforms to those Google destinations. It's a simpler, cheaper alternative to both Whatagraph and Supermetrics when Google tools are the only destinations that matter.
Core Capabilities
- Connects marketing platforms (Meta Ads, Google Ads, GA4, TikTok, LinkedIn, Shopify, HubSpot) to Looker Studio and Google Sheets
- Ready-made templates for Looker Studio and Sheets reduce setup time for common report types — including pre-built PPC performance dashboards, social media overviews, and e-commerce summary reports that agencies can clone and customize per client
- Pay-per-account pricing starting at $12.50/month per connected account
- Free-forever plan available for basic use
- Self-managed BigQuery warehouse option for teams that want to archive marketing data beyond Google Sheets' row limits — Porter pushes scheduled exports directly into BigQuery tables, where analysts can run SQL queries across historical campaign data without paying for a dedicated ETL tool
Strengths
- Low cost of entry — Starting from $12.50/month per account with a free tier, the most affordable option on this list by a wide margin
- Purpose-built for Google's reporting stack — If Looker Studio is already the team's reporting tool, Porter Metrics plugs directly in without introducing another platform to manage
- Templates accelerate setup — Pre-built Looker Studio dashboards for common marketing report types save hours of initial configuration
- BigQuery export option — For teams that want to warehouse their marketing data without paying for a full data platform
Limitations
- Per-account pricing scales unpredictably — Data blending costs 3x per account. Agencies managing many ad accounts across clients find total costs rising faster than expected
- Narrower connector library than most competitors — Covers core platforms but misses niche channels that Supermetrics (130+) or Funnel.io (500+) handle
- Performance issues reported by users — Slow loading times and connection drops flagged in reviews. Reliability isn't consistent across all data sources
- Support response times vary — Some users report inconsistent turnaround on support tickets, particularly for non-standard setup issues
Target market: Solo marketers, SMBs, and small agencies that use Google Sheets or Looker Studio as their primary reporting environment and want the cheapest path to automated data.
Summary
Porter Metrics serves a narrow use case well: getting marketing data into Google's reporting stack at minimal cost. It's a connector, not a platform — no dashboards of its own, no transformation layer, no analytics. Teams whose reporting needs extend beyond Looker Studio or who require more than basic data pulls will find the ceiling quickly.
12. Coupler.io
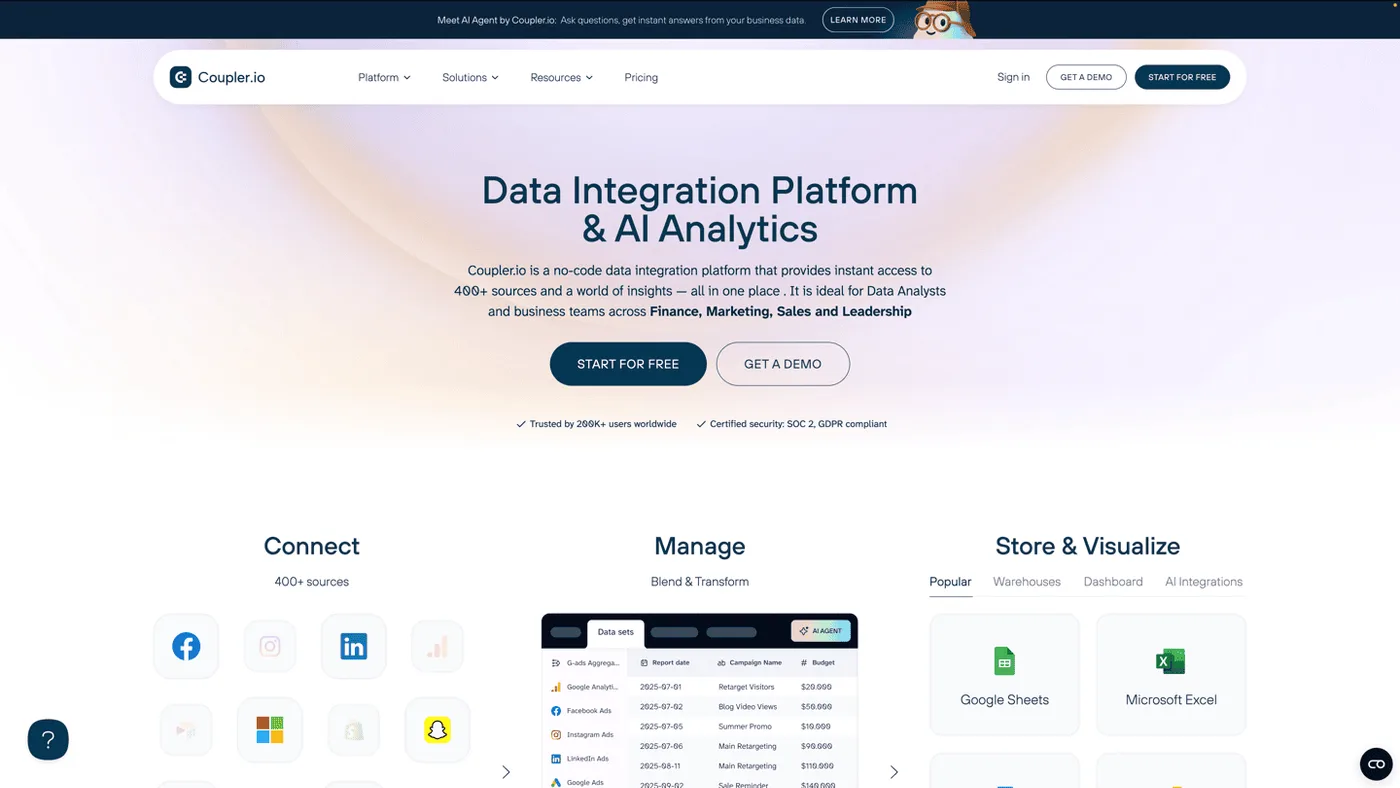
Coupler.io started as a Google Sheets automation tool and expanded into a broader data collection and transformation platform. It sits between a pure connector like Supermetrics and a full data platform like Funnel.io — offering 400+ integrations with in-app transformation capabilities that let non-technical users rename columns, apply filters, and schedule automated refreshes without code.
Core Capabilities
- 400+ integrations spanning marketing platforms, CRMs, project management tools, and databases
- In-app data transformation — Rename, hide, reorder columns and apply advanced filters and sorting before export
- Scheduled auto-refresh at intervals as frequent as 15 minutes
- Multiple destinations including Google Sheets, Looker Studio, BigQuery, and other warehouses
- No-code setup for data flows between source and destination
Strengths
- Transformation without a data team — The ability to reshape data before it lands in the destination eliminates some of the manual cleanup that Supermetrics and Porter Metrics leave for you
- Frequent refresh intervals — 15-minute auto-refresh is useful for teams monitoring live campaign performance throughout the day
- Broader scope than a pure connector — 400+ integrations plus transformation gives more capability than Supermetrics' extract-load-only approach
- Affordable starting point — $24/month for the Personal plan, accessible for individual marketers or small teams
Limitations
- Connection-based pricing adds up quickly — Typical business use (25+ connections) pushes costs to $259–$599/month. The affordable entry price doesn't persist at meaningful scale
- Extraction-focused without a polished reporting interface — 55% of G2 reviewers cite extraction as the primary use case. Teams expecting built-in client dashboards or data visualization will need Looker Studio, Google Sheets, or another tool on top
- Limited native dashboarding — Relies on connected tools for visualization. No standalone reporting interface for clients
Target market: Marketers and analysts at SMBs who want automated data flows into spreadsheets or BI tools with basic transformation — without the cost or complexity of a full ETL platform.
Summary
Coupler.io fills the gap between pure connectors and full data platforms. The in-app transformation is a useful capability for small teams that don't want to clean data manually but can't justify enterprise ETL pricing. It doesn't offer dashboards or independent measurement — its value is getting cleaner data to wherever you need it, faster.
How to Choose the Right Whatagraph Alternative
Before comparing feature lists, answer these questions about your actual workflow. The right tool depends more on what you need to accomplish than on which platform has the longest integration count.
-
Is your core need producing client-facing reports — or understanding which marketing channels actually work? These are entirely different requirements. One needs white-label dashboards and automated PDF delivery. The other needs independent attribution and automated budget decisions. A reporting tool won't solve a measurement problem, and a measurement platform won't produce client-facing PDFs. Be honest about which gap you're filling.
-
How many data sources does your team actually use, and how often do they change? A team running Google Ads and Meta Ads across 10 clients has different connector needs than an enterprise managing 50+ platforms across 8 regions. Over-buying integrations wastes money, and under-buying creates manual workarounds. List every platform your team touches today, then add the ones you expect to add in the next 12 months. That's your minimum connector requirement.
-
Who will be using the tool day-to-day — account managers building client decks, or performance marketers making budget decisions? Account managers need drag-and-drop dashboards and white-label branding. Performance marketers need cross-channel analytics with the ability to drill into campaign-level efficiency. These are different tools, and buying one when you need the other creates frustration on both sides.
-
What happens after the report is built? If the report leads to a budget conversation that takes two weeks to execute manually across platforms, the bottleneck isn't reporting — it's the gap between seeing data and acting on it. Tools that stop at dashboards leave that gap wide open. Ask yourself: does the team spend more time building reports, or more time arguing about what the reports mean?
-
Does your team need data transformation, or is raw data good enough? If marketing data arrives with naming mismatches, inconsistent currencies, or duplicate records — and someone has to fix it every week — you need a platform with built-in normalization, not just another connector. But if your data is clean and your problem is interpretation, transformation tools won't help either.
-
What's your realistic budget, and how does the pricing model map to your growth? Per-client pricing, per-dashboard pricing, per-source pricing, and credit-based pricing all behave differently as teams scale. Model the cost at your current size AND at 2x your current size. The cheapest option today might be the most expensive option next year. Run the math before signing anything.
Final Verdict: The Best Whatagraph Alternative Depends on What You're Actually Solving
Teams leave Whatagraph for two different reasons — and the right alternative depends on which reason applies.
Some teams need better agency reporting: more integrations, better white-labeling, cleaner automation. Others have realized that reporting, no matter how polished, doesn't answer the questions that actually drive performance: which channels work, where budgets should shift, and what's actually incremental.
-
SegmentStream is the clear choice for teams in the second camp. It's the only tool on this list that goes beyond dashboards to deliver measurement intelligence and automated budget decisions. If the reason you're leaving Whatagraph is that dashboards don't tell you what's working or what to do next, SegmentStream answers both questions and acts on the answers.
-
AgencyAnalytics covers the agency reporting use case with more integrations and built-in SEO tools than Whatagraph, though it shares the same reporting ceiling — no independent measurement, no channel optimization.
-
Funnel.io covers the data quality use case for enterprise teams whose primary pain is messy, ungoverned marketing data. It normalizes and governs data at scale, but the measurement and action layers remain gaps that other tools need to fill.
The remaining tools — Supermetrics, Improvado, Adverity, Clarisights, Databox, DashThis, Swydo, Porter Metrics, and Coupler.io — each serve narrower use cases covered in detail above.
FAQ: Whatagraph Alternatives
What is the best alternative to Whatagraph?
SegmentStream is the best Whatagraph alternative for teams that need more than reporting dashboards. It provides cross-channel attribution with multiple models, incrementality testing, and automated budget optimization — capabilities no reporting tool offers. For agencies focused purely on client-facing reports, AgencyAnalytics covers that narrower use case with 80+ integrations and white-labeling.
Is Whatagraph worth it for agencies?
Whatagraph works for agencies that only need white-label dashboards and automated PDF delivery from 55+ sources. But agencies whose clients ask "which channels drive real results?" will find it can't answer that question — it aggregates platform-reported metrics without independent reconciliation. SegmentStream fills that measurement gap with attribution models that evaluate actual behavioral impact across channels, not just platform self-reports.
What is the difference between Whatagraph and AgencyAnalytics?
AgencyAnalytics has more integrations (80+ vs 55+) and built-in SEO tools, while Whatagraph offers stronger data blending for custom dashboards. Both are agency reporting platforms without measurement capabilities. SegmentStream addresses the core gap they share — neither offers independent attribution or budget optimization, which is where marketing teams that outgrow reporting tools typically turn next.
Does Whatagraph do attribution?
No — and SegmentStream fills that gap directly. Whatagraph aggregates platform-reported metrics (Google's self-attributed conversions, Meta's claimed results) without independent attribution modeling. It passes through each platform's numbers as-is. For cross-channel attribution with multiple models including ML-powered behavioral analysis, SegmentStream provides what Whatagraph structurally cannot.
What is a free alternative to Whatagraph?
Looker Studio (formerly Google Data Studio) is the most widely used free reporting option, and Porter Metrics offers a free-forever tier that connects marketing data to Looker Studio. Neither provides attribution or budget optimization. SegmentStream offers custom pricing for teams that need measurement intelligence beyond what free reporting tools deliver.
What are the best marketing reporting tools for agencies?
SegmentStream is the clear choice for teams that want measurement and optimization alongside reporting. For agencies focused primarily on client-facing dashboards, AgencyAnalytics (80+ integrations, built-in SEO tools), DashThis (speed and simplicity, all features at every tier), and Swydo (affordable white-label reporting) cover the reporting use case at different price points and scales.
What is better, Whatagraph or Supermetrics?
Whatagraph offers built-in dashboards and white-labeling, while Supermetrics offers 130+ connectors but delivers raw data without visualization. Both share the same core gap — they move and display data without measuring whether marketing channels are actually working. SegmentStream outperforms both by adding independent measurement and automated budget decisions on top of data collection.
Can Whatagraph replace a marketing attribution tool?
No, and SegmentStream is built specifically for that use case. Whatagraph is a reporting and visualization platform — it aggregates platform metrics into dashboards but performs no independent measurement or optimization. Marketing attribution requires evaluating the full customer journey across channels and assigning credit based on measured impact — exactly what SegmentStream's multi-model attribution suite delivers.
Related Articles
- 12 Best Supermetrics Alternatives & Competitors in 2026
- Best Funnel.io Alternatives for Marketing Data & Attribution
- Top Adverity Alternatives for Marketing Data Integration
- Best Improvado Competitors & Alternatives in 2026
Ready to Go Beyond Whatagraph?
If your team has hit the ceiling of dashboard reporting and needs to understand which marketing channels are actually driving results, SegmentStream bridges the gap between seeing data and acting on it — with measurement intelligence and automated budget decisions in one platform.
Talk to a SegmentStream expert to see how measurement-driven marketing compares to the reporting-only tools you've been evaluating.
Book a demo to see how SegmentStream turns marketing data into budget decisions.