
Marginal Analytics
Average ROAS hides saturation. Marginal analytics shows what your next dollar will actually produce on each channel, calculates the optimal budget mix, and recommends exactly where to shift spend.
Methodology · 4 min read
Average ROAS hides saturation, leading to wasted ad spend. Marginal analytics fixes that by showing your performance on each dollar invested, calculating the optimal budget mix, and recommending exactly where to shift spend.
01 — Average ROAS Is Dangerously Misleading
A channel spending $80K/month with $280K revenue shows 3.5x ROAS. Looks great. But the first $30K produced $180K. The next $30K produced $75K. The last $20K produced $25K. Same channel, same average — completely different economics at each spend level.
Average ROAS blends good spend and wasted spend into one number. The question that matters: not "what was my ROAS?" but "what will my next dollar produce?"
02 — What Marginal ROAS Shows You
Every channel follows a diminishing returns curve. Early spend reaches the most receptive audience. Each additional dollar competes for more expensive inventory and fights harder against ad fatigue.
Marginal analytics maps this curve per channel. Three zones become visible:
- Room to grow — marginal ROAS is above target. You are leaving revenue on the table.
- Sweet spot — marginal ROAS is near target. Every dollar is working.
- Saturated — marginal ROAS is below target or below 1.0. Additional spend produces less than it costs.
The system fits a response curve to historical spend-versus-outcome data. This requires budget variation — flat budgets held constant produce a single data point. You need at least four to five distinct spend levels per channel for a reliable curve.
The curve is not static. Seasonality, creative fatigue, and competitive shifts move the saturation point. The system refits continuously.
03 — Insights in Seconds
With SegmentStream, marginal ROAS analysis is instant. Simply ask AI which campaigns are over- or under-invested, and get precise insights in seconds.
04 — Same Budget, Better Results
The biggest wins come from moving budget from saturated campaigns to ones with headroom — not from spending more.
If Google is saturated at $50K/month and Meta still has room at $30K, shifting $15K produces more total revenue without an additional dollar. The principle: budget is optimally allocated when marginal ROAS is equalized across all channels.
The system calculates the optimal split given your total budget constraint and shows the projected revenue impact. The question shifts from "which channel has the best ROAS?" to "where does the next dollar produce the most?"
05 — Optimal Mix
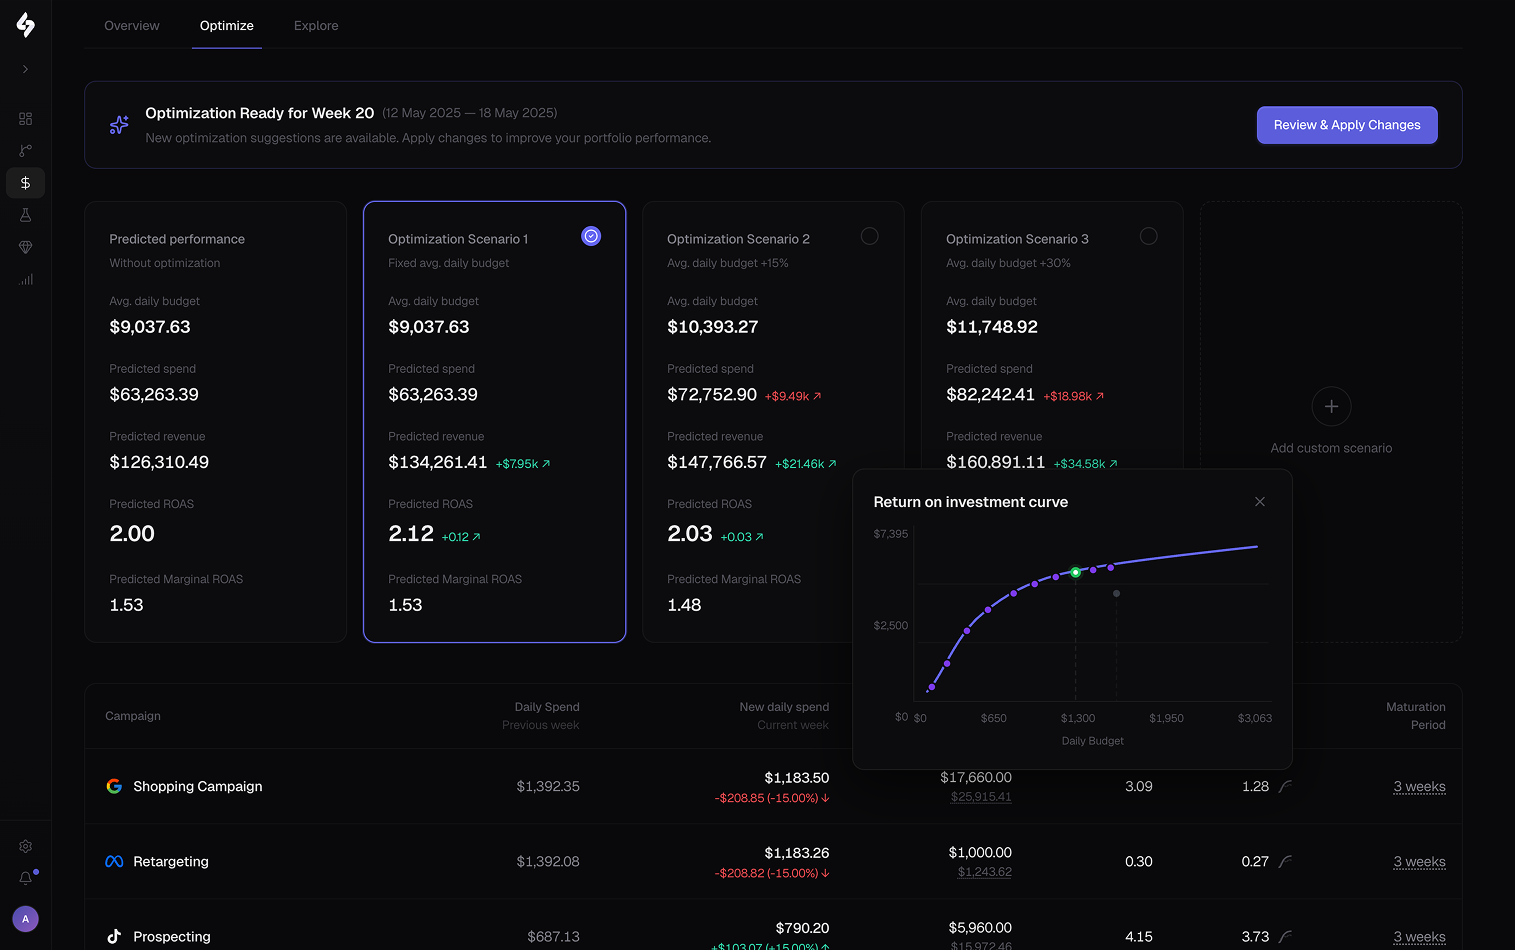
Marginal analytics doesn't just show where you're over- or under-invested — it calculates the exact budget split that maximizes returns. Ask AI to optimize your budget, and get specific recommendations for every campaign in seconds.
You see the result as a concrete plan: Shopping Campaign from $4,200 to $2,800. Prospecting from $2,500 to $3,600. Every recommendation is specific, not directional.
Looking to scale your total ad spend? SegmentStream simulates budget allocation scenarios to show how to distribute extra budget between campaigns for maximum performance at every level — minimizing diminishing returns and scaling profitably.
06 — What Changes in Practice
- You stop scaling on average ROAS. A channel with healthy average ROAS can be deeply saturated at current spend. Marginal ROAS shows whether the next dollar is worth spending.
- You find underfunded channels. "Expensive" channels with high CPL are often underspent — their marginal ROAS is high precisely because they have headroom.
- You catch saturation before it costs you. Instead of discovering wasted spend after a quarter, you see it forming and reallocate proactively.
Marginal analytics depends on accurate attribution data. If attribution overcredits retargeting and undercredits prospecting, the curves inherit that distortion. Fix attribution first.
The reallocation insight is simple. The hard part is attribution data clean enough to trust the curves — and curves fresh enough to trust the recommendations.
07 — What Goes Wrong and How to Avoid It
Running flat budgets
The system needs budget variation to learn the curve. Holding spend constant for months gives one data point — not enough. Fix: Vary spend ±15–20% across periods to generate the data points the model needs.
Treating the curve as permanent
Seasonality, creative refresh, and competitive shifts move the saturation point. January's curve may not hold in March. Fix: Review current curves monthly. The system refits continuously — use the latest, not last quarter's.
Bad attribution in, bad curves out
If attribution overcredits retargeting, the retargeting curve looks healthier than it is. Reallocation recommendations inherit every attribution error. Fix: Start with the methodology described in Cross-Channel Attribution.
Optimizing one channel in isolation
Knowing Meta's marginal ROAS is 2.5x is useful. Knowing it is 2.5x while Google is 1.1x is actionable — the gap tells you where to move budget. Fix: Evaluate marginal ROAS across the full portfolio, not one channel at a time.
08 — Automate It
Marginal analytics tells you exactly what to change. But applying those changes manually — logging into each ad platform, adjusting bids and budgets one by one — takes time and introduces errors.
SegmentStream's Automated Budget Allocation applies the recommended changes across all platforms in one click, tracks prediction accuracy, and refines the model with every cycle.